Editorial Note: Forbes may earn a commission on sales made from partner links on this page.- test default

|
|
You might be using an unsupported or outdated browser. To get the best possible experience please use the latest version of Chrome, Firefox, Safari, or Microsoft Edge to view this website. |
Student loan debt in 2020 is now about $1.56 trillion.
The latest student loan debt statistics for 2020 show how serious the student loan debt crisis has become for borrowers across all demographics and age groups. There are 45 million borrowers who collectively owe nearly $1.6 trillion in student loan debt in the U.S. Student loan debt is now the second highest consumer debt category – behind only mortgage debt – and higher than both credit cards and auto loans. The average student loan debt for members of the Class of 2018 is $29,200, a 2% increase from the prior year, according to the Institute for College Access and Success.
If you are a student loan borrower, the following student loan debt statistics can help you make more informed decisions regarding student loan refinancing, student loan consolidation, student loan repayment and student loan forgiveness.
Student Loan Statistics: Overview
Total Student Loan Debt: $1.56 trillion
Total U.S. Borrowers With Student Loan Debt: 44.7 million
Average Student Loan Debt: $32,731
Average Student Loan Payment: $393
Median Student Loan Debt: $17,000
Median Student Loan Payment: $222
Student Loan Delinquency Or Default Rate: 10.8% (90+ days delinquent)
Direct Loans – Cumulative In Default: $119.8 billion (5.5 million borrowers)
Direct Loan In Forbearance: $122.9 billion (2.8 million borrowers)
(Source: As of 3Q 2019, Federal Reserve & New York Federal Reserve)
Student Loan Forgiveness Statistics
Student loan forgiveness comes in several forms. Two of the most popular types of student loan forgiveness are Public Service Loan Forgiveness and Teacher Student Loan Forgiveness.
Public Service Loan Forgiveness Statistics
As of September 30, 2019, here are the latest public service student loan debt statistics:
Public Service Loan Forgiveness cumulative borrowers: 1,195,497
Borrowers who submitted applications: 109,932
Total number of applications: 136,473
Number of applications approved: 1,561
Number of applications denied: 123,146
% of applications denied due to payments that don’t qualify: 56%
% of applications denied due to missing information: 24%
Borrowers who have received student loan forgiveness: 1,139
Total dollar amount forgiven: $71.9 million
(Source: U.S. Department of Education)
States With The Most Student Loan Debt
Not surprisingly, states with larger populations have higher aggregate student loan debt. California, Florida, Texas and New York are among the four highest states for total student loan debt outstanding among resident borrowers.
California, Florida, Texas and New York represent more than 25 of all U.S. student loan borrowers who collectively owe more than $420 billion of student loan debt.
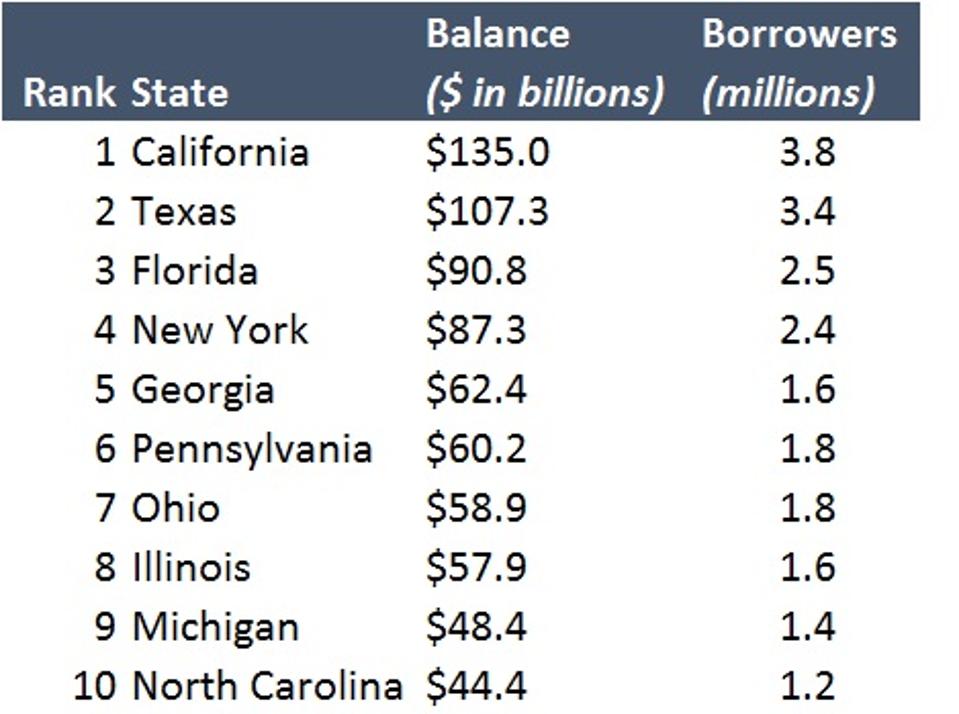
Student Loan Balance By State
FEDERAL STUDENT AID
High Student Loan Debt States & Low Student Loan Debt States
Connecticut has the highest average student loan debt per student ($38,669) from the Class of 2018.
Utah has the lowest average student loan debt per student ($19,728) from the Class of 2018.
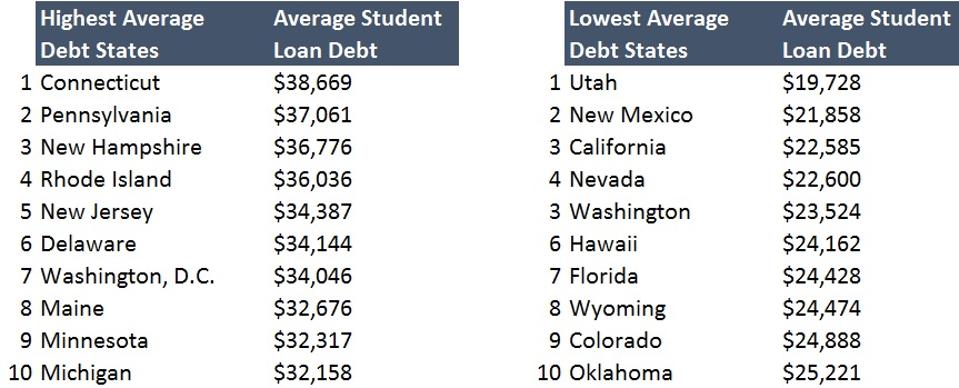
Highest Average Student Loan Debt By State
SOURCE: TICAS
Highest Average and Lowest Average Student Loan Debt By State
Student Loan Debt Per Capita In Select U.S. States
In the U.S., as of 2016, the average student loan debt per capita is $4,920. Pennsylvania, New York and Michigan have among the highest student loan debt per capita in the nation.
Arizona: $4,760
California: $4,160
Florida: $4,480
Michigan: $5,330
New York: $5,570
Ohio: $5,700
Pennsylvania: $5,690
Texas: $4,510
Distribution Of Student Loan Borrowers By Balance
As of 2019, more than 42 million student loan borrowers have student loan debt of $100,000 or less.
More than 3.0 million student loan borrowers have student loan debt greater than $100,000, with approximately 800,000 of that total holding student loan debt greater than $200,000.
The largest concentration of student loan debt is $20,000 – $40,000, which accounts for 9.5 million student loan borrowers.
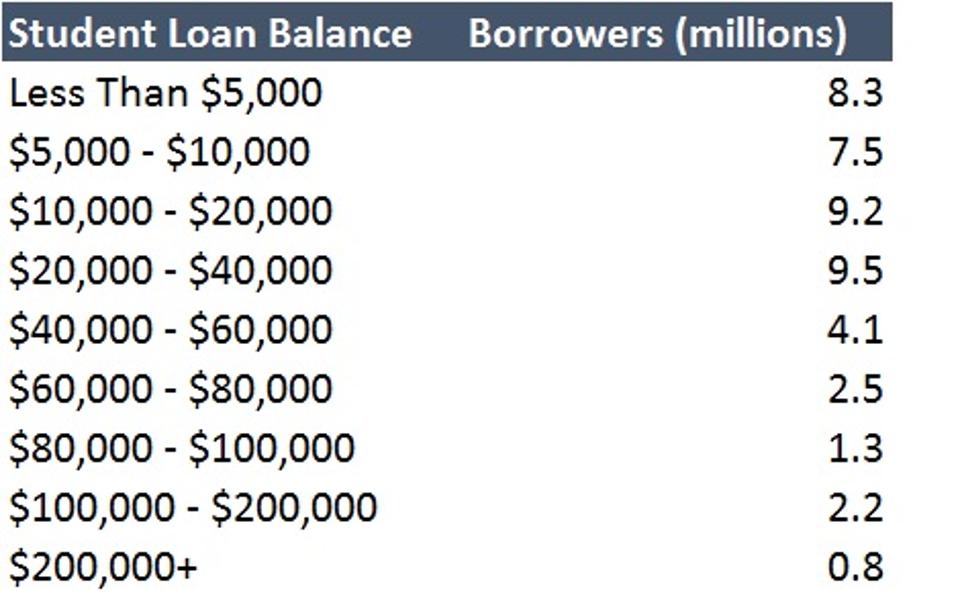
Borrowers By Student Loan Balance
FEDERAL STUDENT AID
Number Of Student Loan Borrowers By Age Group
Based on the federal student loan portfolio, the largest concentration of student loan borrowers is 25 to 34 years-old, followed by the 35-49 age group. There are 23.2 million student loan borrowers under the age of 34, with this group representing more than half of all student loan borrowers.
As of 2019, here is the breakdown of student loan borrowers by age:
< Age 24: $121.2 billion (8.2 million borrowers)
25 – 34: $501.5 billion (15.0 million borrowers)
35 – 49: $575.5 billion (14.1 million borrowers)
50 – 61: $241.2 billion (6.0 million borrowers)
> 62: $75.9 billion (2.1 million borrowers)
Student Loan Debt Outstanding By Student Loan Program
Over 35 million student loan borrowers hold approximately $1.2 billion in Direct Loans. Another 12.1 million student loan borrowers hold $262 billion in Federal Family Education Loans (FFEL).
Direct Loans: $1,242.6 billion (35.1 million borrowers)
Federal Family Education Loans (FFEL): $261.6 billion (12.1 million borrowers)
Perkins Loans: $6.1 billion (2.0 million borrowers)
TOTAL: $1,510.3 billion
Student Loan Debt Outstanding By Student Loan Type
Stafford Subsidized: $280.7 billion (29.5 million borrowers)
Stafford Unsubsidized: $516.0 billion (28.9 million borrowers)
Stafford Combined: $796.7 billion (33.2 million unique borrowers)
Grad PLUS: $75.2 billion (1.4 million borrowers)
Parent PLUS: $96.1 billion (3.6 million borrowers)
Perkins: $6.1 billion (2.0 million borrowers)
Consolidation: $536.1 billion (11.7 million borrowers)
Student Loan Debt Statistics By Loan Status For Direct Loans
Approximately $685 billion in Direct Loans across 18.5 million student loan borrowers are in student loan repayment. Approximately 12 million student loan borrowers are in student loan deferment, student loan forbearance or student loan default.
Student Loans In School: $131.5 billion (7.0 million borrowers)
Student Loans In Repayment: $685.5 billion (18.5 million borrowers)
Student Loans In Deferment: $128.4 billion (3.6 million borrowers)
Student Loans in Forbearance: $122.9 billion borrowers (2.8 million borrowers)
Student Loans In Default: $119.8 billion (5.5 million borrowers)
Student Loans In Grace Period: $45.2 billion borrowers (1.8 million borrowers)
Student Loan Debt Statistics By Repayment Plan For Direct Loans
As of 4Q 2019, there are 10.8 million borrowers with $200.7 billion of student loan debt in the Level Student Loan Repayment Plan (student loan repayment in 10 years or less), which represents the largest concentration of borrowers in student loan repayment.
The second most concentrated group of borrowers is enrolled in Income-Based Repayment (IBR) at $170.4 billion and 2.8 million borrowers.
Level Repayment Plan (< 10 years): $200.7 billion (10.8 million borrowers)
Level Repayment Plan (> 10 years): $77.6 billion (1.7 million borrowers)
Graduated Repayment Plan (< 10 years): $90.4 billion (3.0 million borrowers)
Graduated Repayment Plan (> 10 years): $16.7 billion (0.3 million borrowers)
Income-Contingent Repayment (ICR) Plan: $33.6 billion (0.7 million borrowers)
Income-Based Repayment (IBR) Plan: $170.4 billion (2.8 million borrowers)
Pay As You Earn (PAYE) Plan: $96.7 billion (1.4 million borrowers)
Revised Pay As You Earn (REPAYE) Plan: $168.9 billion (2.9 million borrowers)
(Source: NSDLS)
Student Loan Servicer By Loan Status
For Direct Loan and FFEL Loans owned by the U.S. Education Department, here is the breakdown by these select student loan servicers:
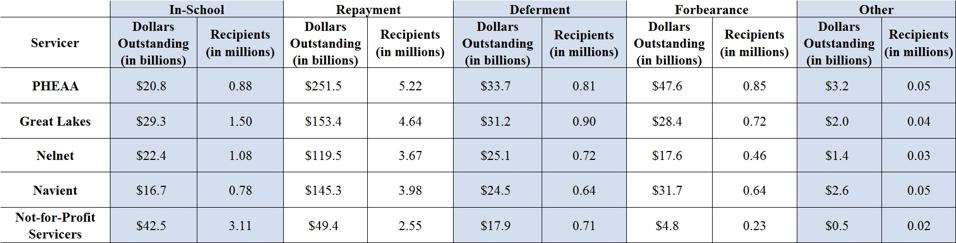
Federal Student Loan Servicers – Payment
FEDERAL STUDENT LOAN AID
Other Important Student Loan Debt Statistics
In addition, there are several other startling statistics regarding the state of student loan debt:


![Best Private Student Loans Of 2020 – Award v2 [Review]](http://fbadvisor-dev.testingpe.com/wp-content/uploads/2020/09/connecticut-road-sign-e1584318000526-568x322.jpg)


